Successfully serving local market within many years

Access to FMCG market in Latvia - call it Leversa 

Economy of Latvia 


GDP = $34.881 billion (nominal, 2018)

GDP growth = 2.1% (2016); 4.6% (2017); 4.8% (2018); 3.1% (2019e)

GDP per capita = $18,031 (nominal, 2018)

GDP by sector = agriculture: 3.9%, industry: 22.4%, services: 73.7% (2017 est.)

Inflation (CPI) = 2.427% (2019 est.), 2.554% (2018)

Labour force = 0.990 million (2017 est.); 76.8% employment (2018)

Unemployment              = 7.4% (2018, Eurostat)

Average gross salary = €1,064 / $1,190 monthly (March, 2019)

Average net salary =  €791 / $885 monthly (March, 2019)

Main industries - processed foods, processed wood products, textiles, processed metals, pharmaceuticals, railroad cars, synthetic fibers, electronics

Imports                = $15.79 billion (2017 est.)

Current account = -$231 million (2017 est.)

Public debt = 36.3% of GDP (2017 est.)

Budget balance = −0.5% (of GDP) (2017 est.)


Leversa Distribution Universe

Leversa covers various distribution channels:

- open markets, wholesalers, food service outlets.
- cash & carry outlets;
- independent shops;
- discounter chains;
- hyper and supermarket chains;

Capacities of our NEW warehouse:
- 102 pallet places for chilled goods
- 4,632 pallet-places for dry groceries
- location is next to the Riga cargo harbour


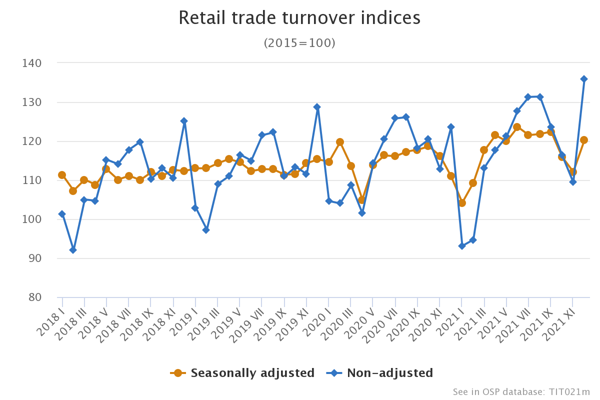
Retail market indices


of retail trade enterprises by main kind of economic activity (at constant prices)

Turnover indices of retail trade enterprises by main kind of economic activity
(at constant prices)

December 2021 as %,
compared to
November 2021 (seasonally adjusted) December 2020 (calendar adjusted)
Retail trade – total 107.2 108.3
retail sale of food products 100.3 101
retail sale of non-food products (except for retail sale of automotive fuel) total 114.2 116.2
retail sale in non-specialised stores selling mainly non-food products 119.5 116.9
retail sale of information and communication equipment in specialised stores 103.1 97.4
retail sale of electrical household appliances 100.5 108.6
retail sale of hardware, instruments, construction materials and sanitary equipment 130.7 117.7
retail sale of cultural and recreation goods 129.1 143.8
retail trade in pharmaceutical and medical goods 98.5 101.6
retail sale of cosmetics and toiletries 100.8 114
retail sale of clothing, footwear and leather goods 168.9 162.8
retail sale in stalls or markets 112.7 108.7
retail sale via mail order houses or via Internet 82.4 114.1
retail sale of automotive fuel 105.4 104.4
Calendar adjusted data at constant prices compiled by the Central Statistical Bureau (CSB) show that in 2021, compared to 2020, retail trade turnover grew by 2.5 %.
Turnover of retail sale of food products
  increased by 0.1 %.

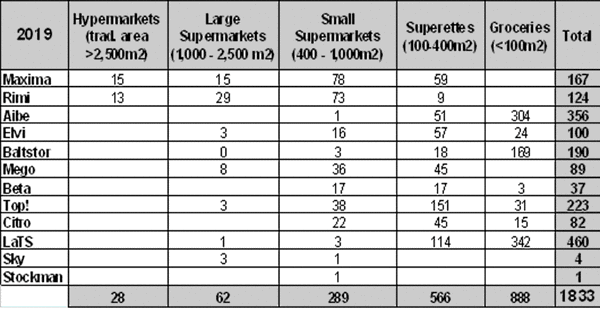
Latvian Retail Market Universe*

Modern Trade 2019  


Stores of any formats  dealing mainly with sales of general foodstuff

Trade Sector Classification

Store chains in Latvia


Explore store information

You are welcome to explore more information on Latvia stores by clicking store logos.